Grafana
Overview
Grafana is a free visualization tool for metrics. You can easily connect Grafana to the Monitor Mountain API to explore and visualize your metrics.
Installation
If you do not already use Grafana to visualize your metrics please visit the Grafana documentation website and follow installation instructions. Alternatively many cloud providers have a 1-click install:
Connect to Monitor Mountain
Grafana will connect to Monitor Mountain using the Prometheus data source API. Monitor Mountain's API gateway has full support for the Prometheus query language called PromQL.
To add the data source, follow these instructions:
Create a Monitor Mountain API Token

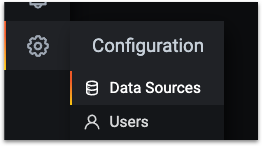
In Grafana, move your mouse to the cog on the side menu. Click on Configuration > Data Sources

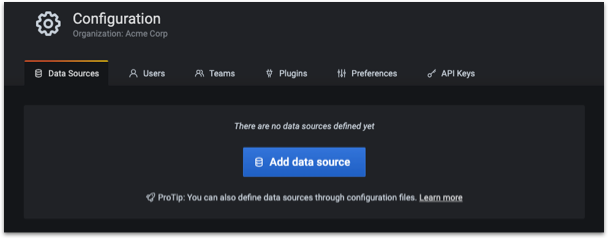
Click the Add data source button

Find the Prometheus datasource type and click Select

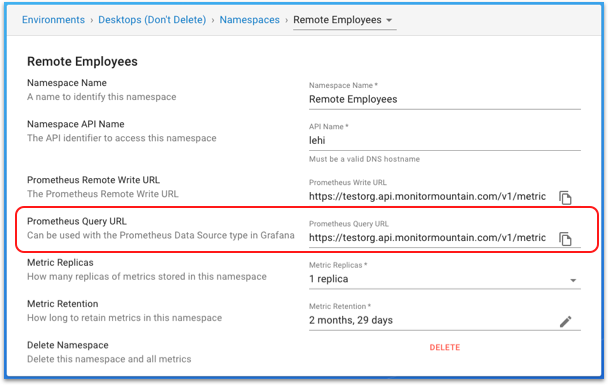
In Monitor Mountain Environments page navigate to Environment > Namespace then find Prometheus Query URL and copy the URL.

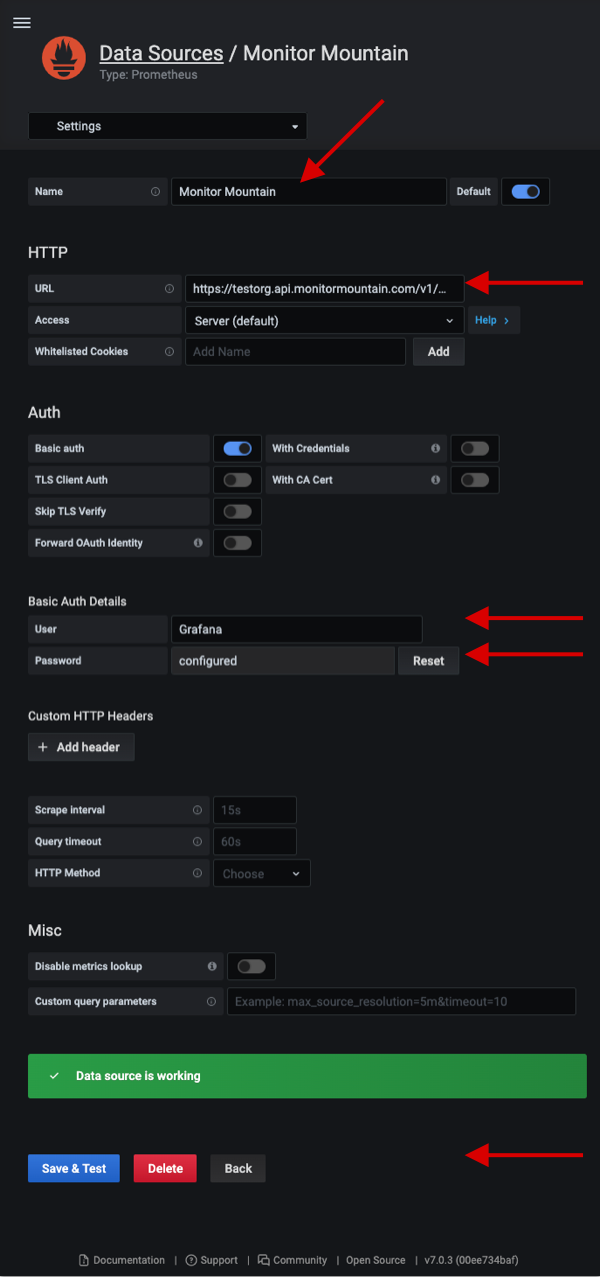
Fill in the following fields
Field Value Name Monitor Mountain (namespace name) URL They URL copied in step 5 User This can be any name. A good practice is to use the same name you created for the Monitor Mountain API Token in step 1 Password Paste in the Monitor Mountain API Token from step 1 Click Save & Test
